Conversion to time series
c3s_sm reshuffle
By using the readers described in the previous chapter, the program c3s_sm reshuffle converts images in a directory into a time series format for performant reading (https://github.com/TUW-GEO/pynetcf).
This package provides a command line tool c3s_sm reshuffle for this purpose. e.g the following shell command will take all images for the year 2020 in the give image directory and store soil moisture data in the bounding box from 5-15 °E and 47-55 °N as time series in the chosen output path.
c3s_sm reshuffle /path/to/images /output/path -s 2019-10-01 -e 2020-01-31 -p sm --bbox 5 47 15 55
The same cane be done via the python API
[1]:
%%capture
from c3s_sm.reshuffle import img2ts
from tempfile import mkdtemp

in_path = '../../tests/c3s_sm-test-data/img/TCDR/061_monthlyImages/combined'
out_path = mkdtemp()

img2ts(in_path, out_path, startdate='2016-04-01', enddate='2016-05-01', bbox=[5, 47, 15, 55])
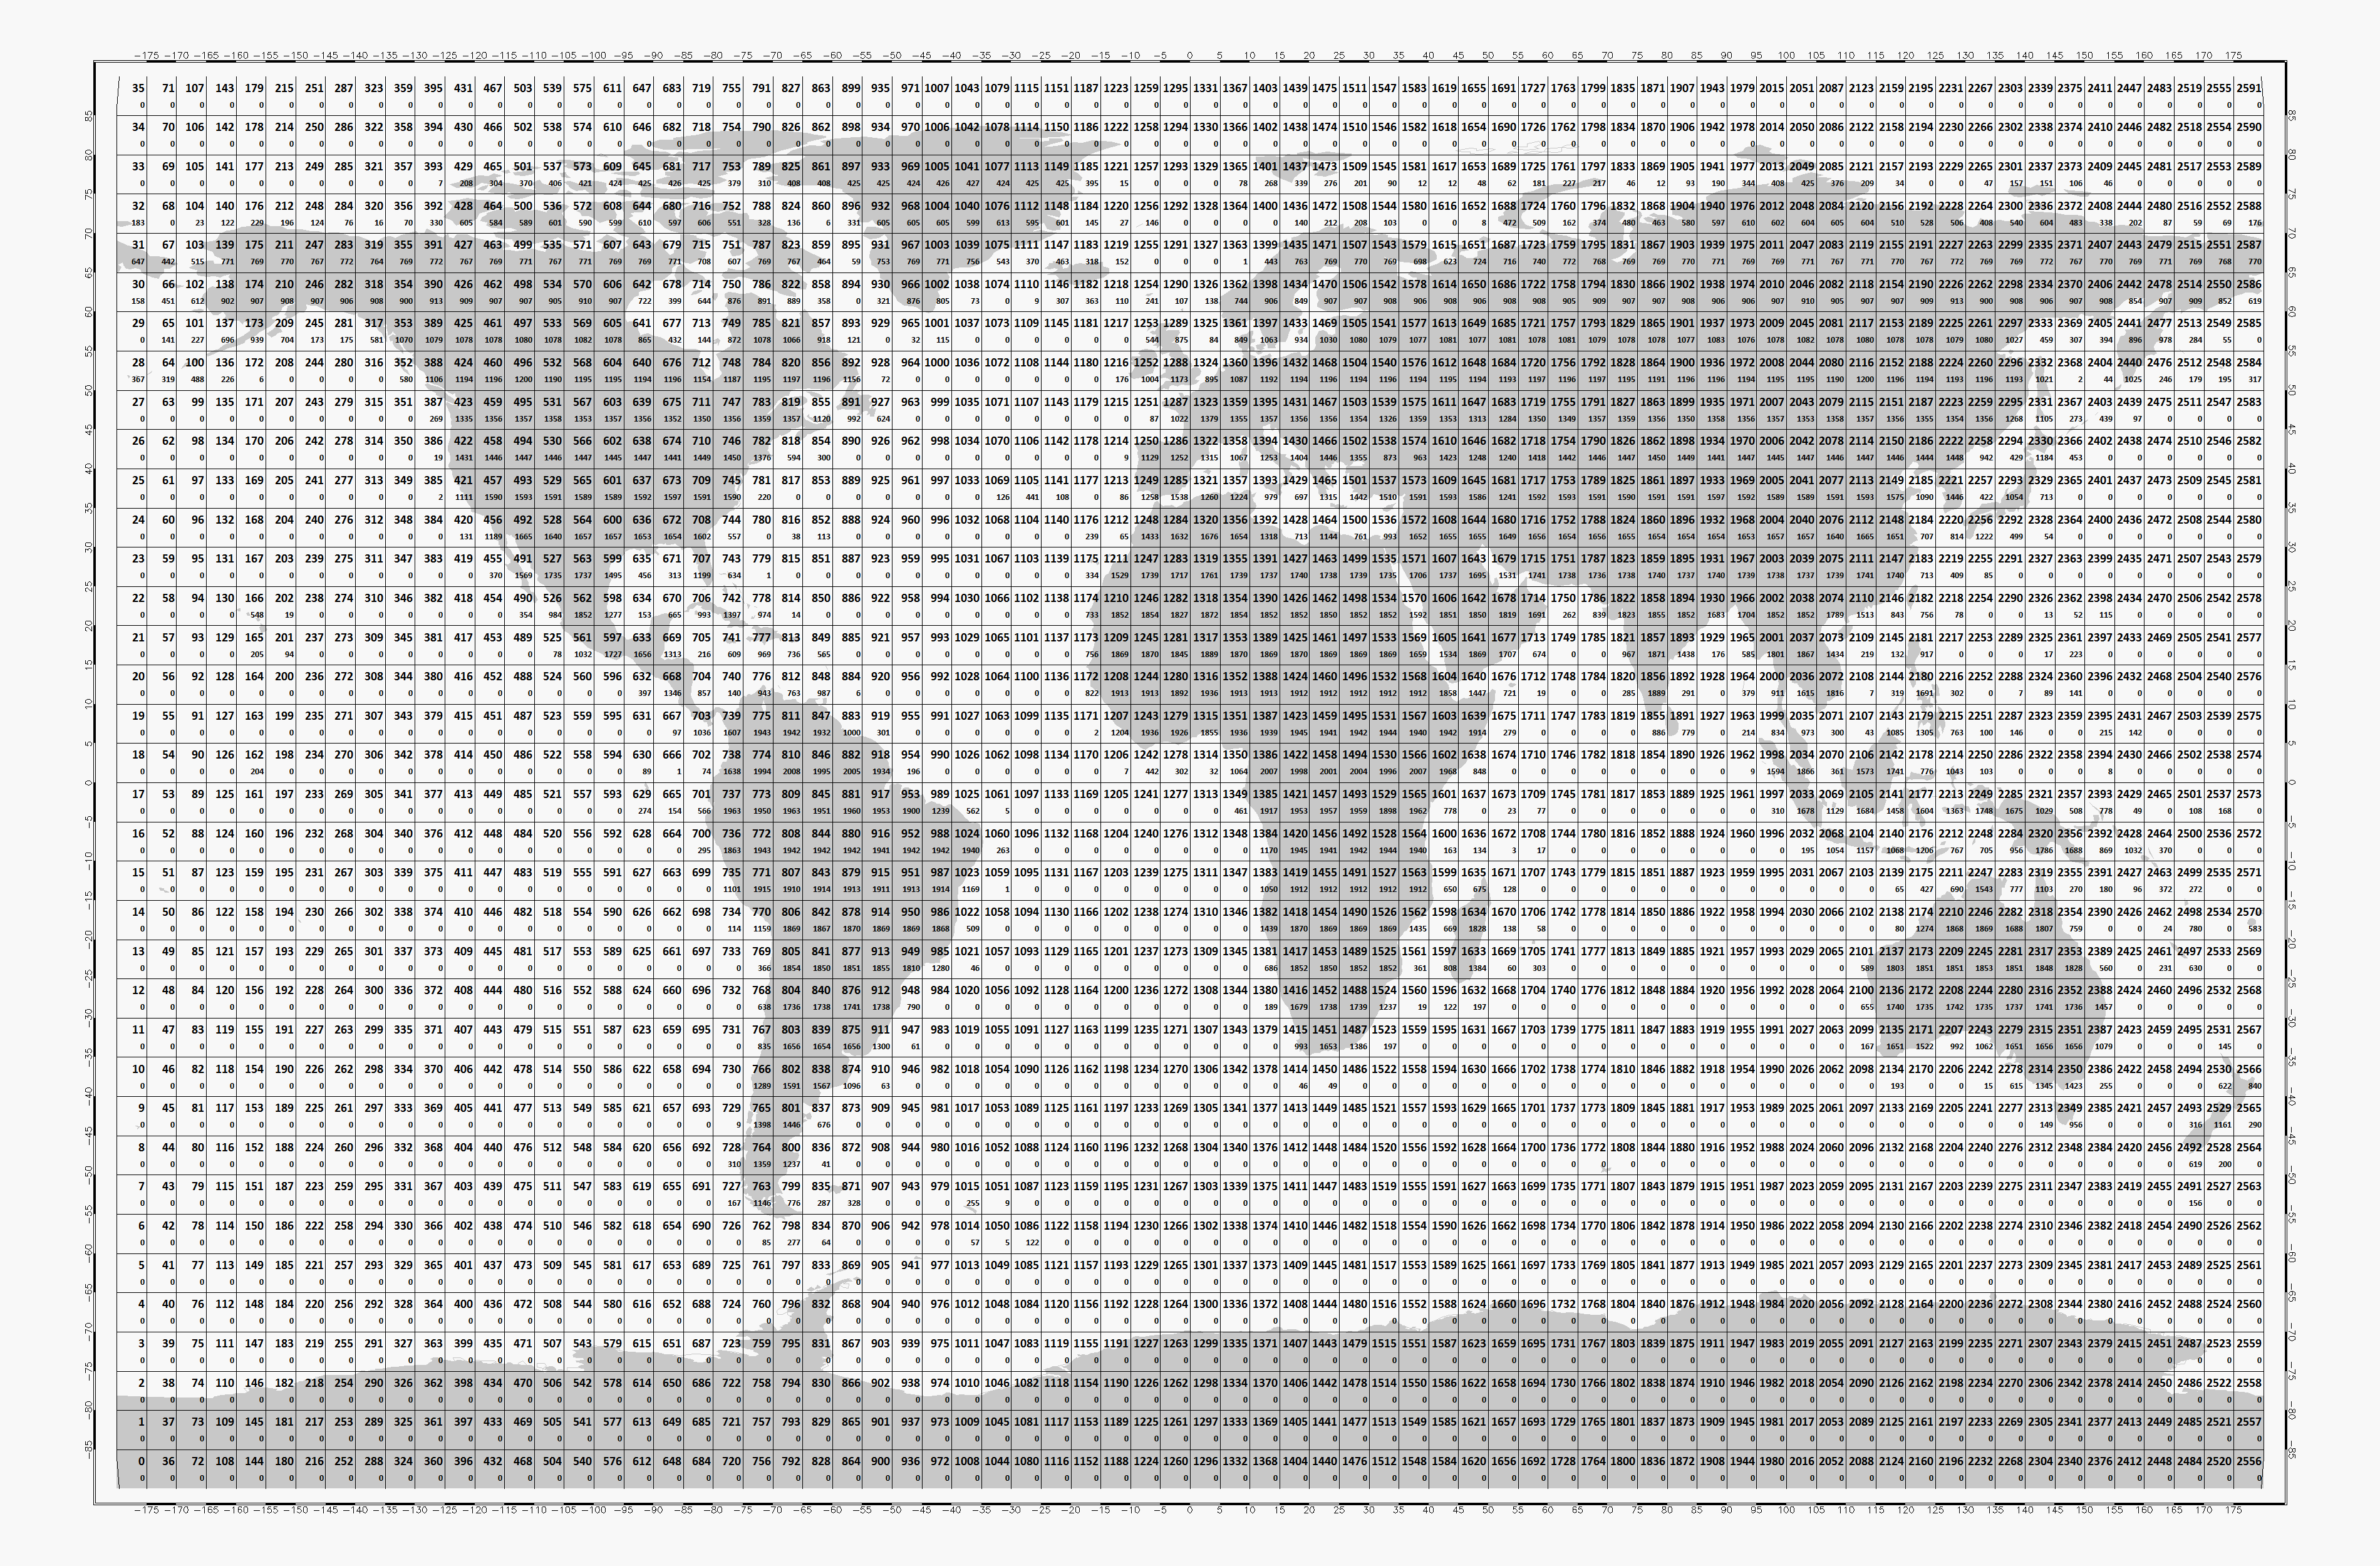
This will generate data cubes of 5x5 degrees (compare figure below) that contain up to 400 time series each.
Afterwards, we can use the time series reader class and read the data at one of the converted locations (if we pass a coordinate pair, the nearest grid cell is used). Note that for this example we only used 2 (monthly) test data images.
[2]:
from c3s_sm.interface import C3STs
reader = C3STs(out_path, ioclass_kws={'read_bulk': True})
gpi, dist = reader.grid.find_nearest_gpi(9, 49)
print("Distance to nearest grid cell at Lat: 49 °N, Lon: 9 °E: ", f"{dist:.02f}", 'metres')
ts = reader.read(gpi)   # or reader.read(9, 49)
reader.close()
ts
Distance to nearest grid cell at Lat: 49 °N, Lon: 9 °E: 16634.19 metres
[2]:
| nobs | sensor | freqbandID | sm | |
|---|---|---|---|---|
| 2016-04-01 | 30 | 512 | 2 | 0.298179 |
| 2016-05-01 | 31 | 768 | 2 | 0.267991 |
c3s_sm update_ts
In line with the program c3s_sm update_img there is also c3s_sm update_ts is used to extend a time series dataset with the newest image data (e.g. as part of a recurring job).
c3s_sm update_ts /image/path /time/series/path
The same can be done in python
[3]:
from c3s_sm.reshuffle import extend_ts

extend_ts(in_path, ts_path=out_path)
If we read the same time series again now, we see that data from an additional image was appended.
[4]:
reader = C3STs(out_path, ioclass_kws={'read_bulk': True})
ts = reader.read(gpi)   # or reader.read(9, 49)
ts
[4]:
| nobs | sensor | freqbandID | sm | |
|---|---|---|---|---|
| 2016-04-01 | 30 | 512 | 2 | 0.298179 |
| 2016-05-01 | 31 | 768 | 2 | 0.267991 |
| 2016-06-01 | 30 | 768 | 2 | 0.292918 |